
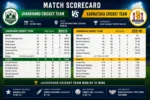
Comparing cricket scorecards can help fans understand differences between teams, players, and match conditions. sportstatsflow.com supports readers who want to explore cricket statistics and interpret scorecard information beyond basic winning margins. A useful comparison needs consistent figures and a clear understanding of the match format. Otherwise, numbers that appear similar may describe very different performances.
Choose Comparable Match Figures
Start by deciding what you want to compare before looking through the scorecards. You might compare batting totals, individual strike rates, bowling economy rates, or wickets taken. Each question requires a different set of statistics. Choosing a clear purpose prevents unrelated numbers from becoming mixed together.
The match format should remain consistent whenever possible. A T20 innings and a Test innings have different scoring expectations and available time. Comparing their raw totals without considering those differences can produce misleading conclusions. Similar formats usually provide a more useful starting point.
Conditions also affect comparisons between matches. Pitch behaviour, weather, ground dimensions, and opposition quality may influence scoring opportunities. A high total on one ground may be more impressive than the same total elsewhere. Scorecards show the recorded figures, but match conditions help explain their significance.
Compare Team Batting Totals
Team totals provide a straightforward way to compare innings results. Look at the runs scored, wickets lost, overs used, and extras included in each total. These figures show both the final output and some of the conditions behind it. A total should not be judged in isolation.
A team scoring 190 runs in a limited overs match may appear strong. However, the same total could represent different performances depending on the number of overs available. Scoring 190 in twenty overs requires a different pace from scoring 190 in forty overs. The format and innings length matter.
Wickets lost also change the interpretation of a total. A team reaching 190 with only three wickets down may have retained more batting resources. Another team reaching the same score after losing nine wickets may have struggled to maintain its innings. Both teams scored equally, but their innings developed differently.
Review Individual Batting Numbers
Individual scorecards help compare the contributions made by different batters. Runs, balls faced, strike rate, boundaries, and dismissal details provide useful evidence. These figures can show whether a player built an innings slowly or scored quickly. Batting position and match requirements should also be considered.
A batter scoring fifty from thirty balls has a strike rate of about 166.67. Another batter scoring fifty from sixty balls has a strike rate of about 83.33. These results indicate different scoring speeds, but neither figure automatically determines the better performance. A longer innings may be useful when the team needs stability.
Boundary counts provide additional information about scoring methods. One player may score through regular fours and sixes, while another collects singles and twos consistently. Both approaches can contribute to a competitive total. Reviewing several statistics together provides a more complete comparison than using runs alone.
Assess Bowling Performances Fairly
Bowling comparisons commonly involve wickets, runs conceded, overs, and economy rate. These figures show whether a bowler took wickets, restricted scoring, or completed a demanding spell. They also help readers identify different bowling roles. A new-ball bowler and a death-overs specialist may face different challenges.
A bowler taking four wickets may have created significant pressure on the batting side. However, the runs conceded and timing of those wickets remain important. Another bowler might take only one wicket while maintaining a very low economy rate. Depending on the match situation, both contributions may be valuable.
The overs bowled should always be considered when comparing figures. Conceding thirty runs in three overs differs from conceding thirty runs in six overs. The same number of wickets can also mean different things depending on which batters were dismissed. Context makes bowling comparisons more balanced.
Understand Scorecard Differences
Different scorecard providers may organise information in slightly different ways. Some display detailed batting and bowling tables, while others prioritise the final score and result. Certain pages include partnerships, fall of wickets, and ball-by-ball information. Readers should understand the layout before comparing figures from separate sources.
Check whether the figures describe the same innings or match stage. A live scorecard may change as new deliveries are completed, while a completed scorecard shows the final official record. Comparing a live total against a final total can create confusion. Confirm the match status before using the numbers.
Units and notation also deserve attention. Overs displayed as 18.3 mean eighteen completed overs and three additional legal balls, rather than eighteen point three mathematical overs. Bowling figures may use compact notation such as 2/24. Understanding these conventions prevents errors when transferring information into notes or spreadsheets.
Look Beyond One Match
One scorecard can reveal what happened during a particular match, but it cannot establish a player’s complete ability. Conditions and opposition can change significantly from one game to another. A batter may have an excellent innings one day and struggle during the next match. A wider sample offers a more balanced view.
When reviewing several scorecards, look for repeated patterns rather than focusing only on the highest number. A batter who regularly scores at a useful pace may provide dependable contributions. A bowler who consistently controls runs can support the team even when wickets are limited. Repeated performance often provides better evidence than one standout result.
Career averages and tournament statistics can add another layer of information. However, those figures should be checked for the number of matches played and the format involved. Averages based on very few performances may change considerably. Keep the sample size in mind when drawing conclusions from statistical comparisons.
Conclusion
Cricket scorecard comparison works best when the format, match conditions, and relevant statistics are considered together. Team totals, batting figures, bowling performance, and repeated trends each provide different insights. Consistent methods help readers avoid misleading comparisons and understand the numbers more accurately. Explore cricket statistics through sportstatsflow.com and use scorecard analysis to develop a clearer view of team and player performances.
Read also :-
